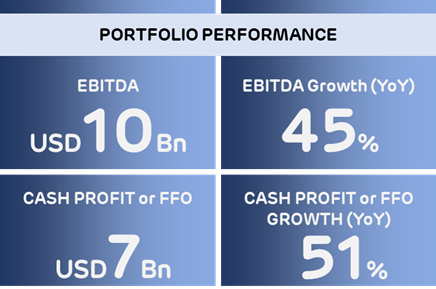
45% EBITDA growth in FY24, EBITDA reaches INR 82,917 crore (USD 10 Bn)
Editor Synopsis
 |
|
 |
|
Ahmedabad, 2 June 2024: In line with our commitment to upholding the highest standards of transparency, we are pleased to release the Adani Portfolio’s Credit and Result compendium for financial year 2023-24. These offer deep insights into the financial performance of the portfolio, reinforcing our dedication to providing clear and detailed information to stakeholders and the public.
The performance in FY24 and the past five years signify the strength and stability of the Adani Portfolio and the robustness of its businesses, which despite all external volatilities and headwinds, continue to deliver strong and consistent growth year after year. It also highlights the superior capital allocation strategy that maximises returns and minimises risks.
Adani Portfolio reports strongest financial results till date
In FY24, the Adani Portfolio of companies rose to its best, showcasing resilience, strength and stability and delivering a record EBITDA growth of 45%. With surging cashflows and enhanced credit profiles, the Adani Portfolio is in astromg ‘stronger than ever’ position to accelerate growth.
Financial performance for FY24
(Figs in INR crore)
|
Sector |
FY24 |
FY23 |
Growth |
% of Total |
|
Utility 2 |
44,446 |
27,842 |
59.64% |
53.60% |
|
Transport |
17,202 |
14,434 |
19.18% |
20.75% |
|
AEL - Infrastructure Businesses |
7,689 |
5,411 |
42.09% |
9.27% |
|
A. Sub-total (Infrastructure) |
69,337 |
47,687 |
45.40% |
83.62% |
|
B. Adjacencies (Cement) |
7,589 |
4,368 |
73.36% |
9.15% |
|
Sub-total (Infra +Adjacencies) |
76,925 |
52,055 |
47.78% |
92.77% |
|
C. AEL- Existing Businesses |
5,992 |
5,151 |
16.33% |
7.23% |
|
Portfolio EBITDA (A+B+C) |
82,917 |
57,205 |
44.95% |
100% |
Utility = Adani Power Limited + Adani Green Energy Limited + Adani Total Gas Limited + Adani Energy Solutions Limited | Transport = Adani Ports and Special Economic Zone Ltd | AEL: Adani Enterprise Limited EBITDA: Earnings before Interest Tax Depreciation & Amortization I EBITDA: PAT + Share of profit from JV + Tax + Deferred Tax + Depreciation + Finance Cost + Forex Loss / (Gain) + Exceptional Items
- EBIDTA: Consistently advancing EBITDA increased to INR 82,917 crore (approx. USD 10 Bn) with record 45% growth year-on-year, highest in the history of the Adani Portfolio.
- Cash Profit or FFO: Cash Profit of Funds Flow from Operations (FFO) was at INR 56,828 crore (approx. USD 6.7 Bn) , registering a growth of 51% year-on-year, thanks to its disciplined investment strategy providing high conversion of EBITDA into cash profit.
- Core infrastructure EBITDA: Sustained growth in EBITDA is due to a high contribution of the core infra and utility platform, which offers a high level of predictability, stability, and visibility. The core infra and utility platform generated INR 69,337 crore or 84% of the total EBITDA. The user base of the platform has increased to over 350 million, with a fast-growing consumer franchise across airports, electricity distribution, smart metering, gas distribution and direct to consumer digital platform.
- Gross Assets: Total Gross Assets increased by INR 65,901 crore (USD 8 Bn) or 16% and now stand at INR 4,78,137 crore (USD 57.4 billion),
- Conservative leveraging: Rising cash profit lowered the net leverage significantly. Net Debt to EBITDA is down from 3.3x at the end of FY23 to 2.2x, notably lower than the industry benchmark. Adani Portfolio now has the balance sheet capacity for even higher growth.
